Swordfish Trading Systems
Synergy Solanum Trading System - V1.1
Synergy Solanum was back tested using Amibroker and data starting on 20/07/1999 and ending 31/12/2012.
Initial equity is set as R 50,000.00 and trade commissions are calculated at R 14.00 per trade.
Performance
Margin of R 18,000.00 per contract is assumed and only one contract is traded throughout the test, even though the equity growth would allow for an increasing number of contracts to be traded, resulting in much larger profits. Margin available for trade is set to 40% of equity in the sidebar calculation.
Max Contracts
1
10
50
Profit
R 862,188.00
R 7,640,890.00
R 33,987,994.00
Trades are executed at the opening price of the next bar. There are no profit, loss or trailing stops used.
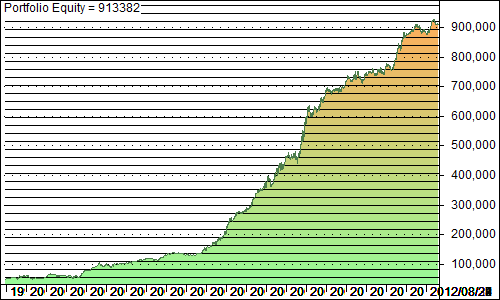
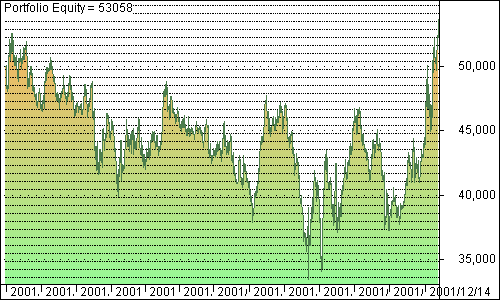
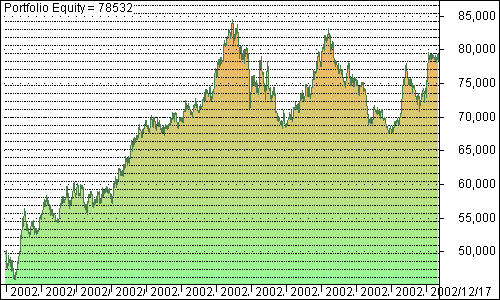
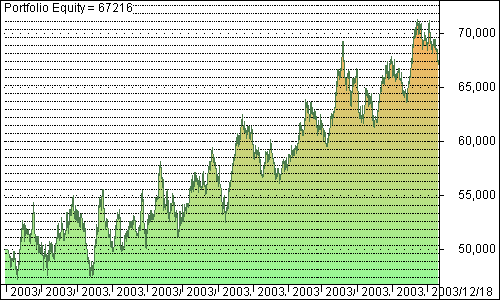
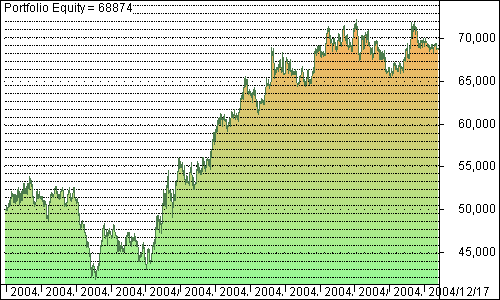
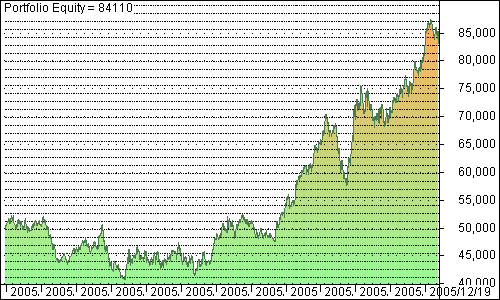
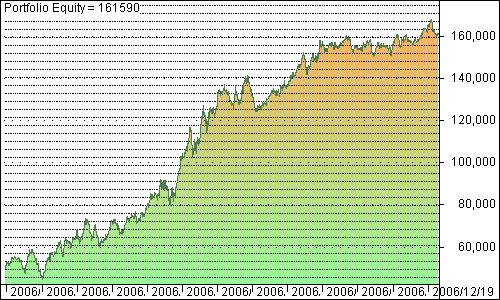
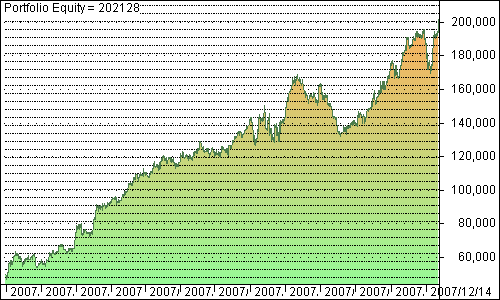
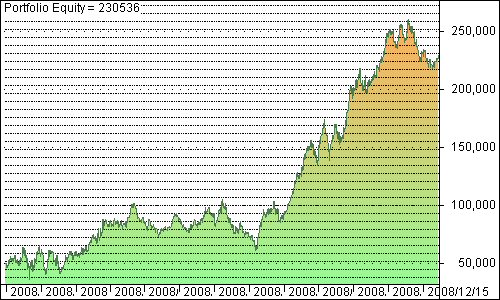
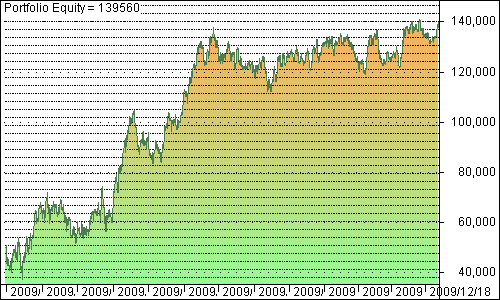
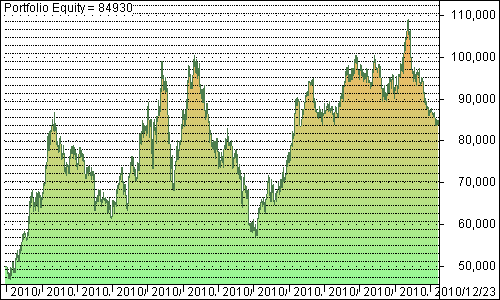
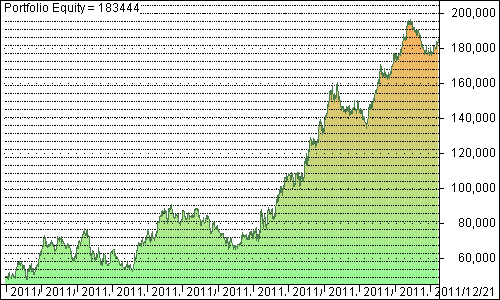
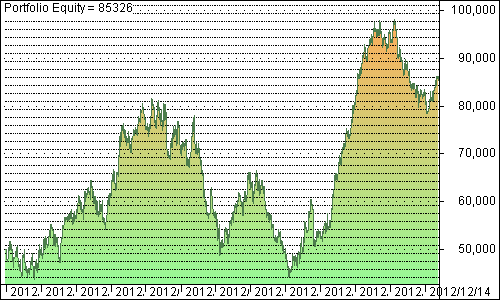
Portfolio Equity
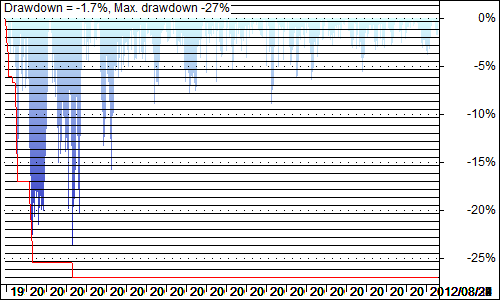
Underwater Equity
Profit and Loss by Year
The Portfolio Equity chart becomes somewhat squashed due to the extreme duration of the back test.
The annual breakdown below shows more detail. Click on the portfolio equity chart to see the growth and drawdowns in more detail.
You will notice that Solanum was profitable every year of the test.
Year
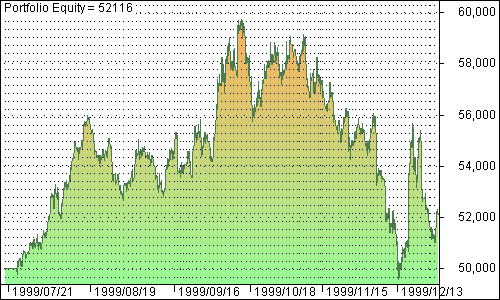
1999
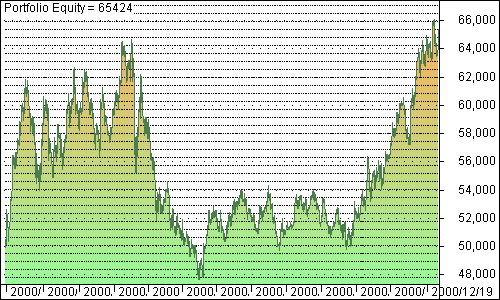
2000
2001
2002
2003
2004
2005
2006
2007
2008
2009
2010
2011
2012
Total:
Portfolio Equity
Profit
R 2,116.00
R 15,424.00
R 3,058.00
R 28,532.00
R 17,216.00
R 18,874.00
R 34,110.00
R 111,590.00
R 152,128.00
R 180,536.00
R 89,560.00
R 34,930.00
R 133,444.00
R 35,326.00
R 856,844.00
Drawdown
R 10,160.00
R 17,074.00
R 19,200.00
R 17,026.00
R 7,966.00
R 12,102.00
R 12,942.00
R 17,542.00
R 37,244.00
R 44,388.00
R 25,724.00
R 43,656.00
R 26,920.00
R 37,226.00
Trades
103
227
269
266
238
267
280
250
254
233
290
275
227
283
3462
Winners
42
91
100
112
98
104
113
108
124
106
115
111
102
113
1439
Win %
40.78%
40.09%
37.17%
42.11%
41.18%
38.95%
40.36%
43.20%
48.82%
45.49%
39.66%
40.36%
44.93%
39.93%
Full Back Test Statistics
| Statistics |
|---|
| All trades | Long trades | Short trades | |
|---|---|---|---|
| Initial capital | 50000.00 | 50000.00 | 50000.00 |
| Ending capital | 913382.00 | 628416.00 | 334966.00 |
| Net Profit | 863382.00 | 578416.00 | 284966.00 |
| Net Profit % | 1726.76 % | 1156.83 % | 569.93 % |
| Exposure % | 12.27 % | 6.56 % | 5.71 % |
| Net Risk Adjusted Return % | 14077.93 % | 17643.26 % | 9983.12 % |
| Annual Return % | 23.99 % | 20.61 % | 15.12 % |
| Risk Adjusted Return % | 195.60 % | 314.27 % | 264.82 % |
|
| |||
| All trades | 3476 | 1738 (50.00 %) | 1738 (50.00 %) |
| Avg. Profit/Loss | 248.38 | 332.81 | 163.96 |
| Avg. Profit/Loss % | 1.38 % | 1.85 % | 0.91 % |
| Avg. Bars Held | 18.84 | 19.94 | 17.74 |
|
| |||
| Winners | 1444 (41.54 %) | 758 (21.81 %) | 686 (19.74 %) |
| Total Profit | 3177148.00 | 1660566.00 | 1516582.00 |
| Avg. Profit | 2200.24 | 2190.72 | 2210.76 |
| Avg. Profit % | 12.22 % | 12.17 % | 12.28 % |
| Avg. Bars Held | 26.04 | 26.56 | 25.47 |
| Max. Consecutive | 9 | 9 | 7 |
| Largest win | 21882.00 | 18972.00 | 21882.00 |
| # bars in largest win | 40 | 52 | 40 |
|
| |||
| Losers | 2032 (58.46 %) | 980 (28.19 %) | 1052 (30.26 %) |
| Total Loss | -2313766.00 | -1082150.00 | -1231616.00 |
| Avg. Loss | -1138.66 | -1104.23 | -1170.74 |
| Avg. Loss % | -6.33 % | -6.13 % | -6.50 % |
| Avg. Bars Held | 13.72 | 14.82 | 12.70 |
| Max. Consecutive | 14 | 10 | 18 |
| Largest loss | -13608.00 | -12528.00 | -13608.00 |
| # bars in largest loss | 64 | 26 | 64 |
|
| |||
| Max. trade drawdown | -26850.00 | -26850.00 | -20300.00 |
| Max. trade % drawdown | -95.30 % | -95.30 % | -93.77 % |
| Max. system drawdown | -44388.00 | -43166.00 | -41224.00 |
| Max. system % drawdown | -27.05 % | -27.36 % | -36.82 % |
| Recovery Factor | 19.45 | 13.40 | 6.91 |
| CAR/MaxDD | 0.89 | 0.75 | 0.41 |
| RAR/MaxDD | 7.23 | 11.49 | 7.19 |
| Profit Factor | 1.37 | 1.53 | 1.23 |
| Payoff Ratio | 1.93 | 1.98 | 1.89 |
| Standard Error | 95740.69 | 51514.10 | 49226.29 |
| Risk-Reward Ratio | 0.76 | 0.90 | 0.53 |
| Ulcer Index | 6.18 | 5.86 | 12.56 |
| Ulcer Performance Index | 3.01 | 2.59 | 0.77 |
| Sharpe Ratio of trades | 1.53 | 2.01 | 1.03 |
| K-Ratio | 0.0119 | 0.0142 | 0.0083 |
Forward Tested Results
Forward testing for Solanum started in 2013 after the system parameters were finalized.
These are the results achieved had the system been executed flawlessly with no incurred slip. Actual live trade results will differ.

Setup and Trade Criteria
Two indicators are used for this trading system, both with their default parameters.
Indicator
MACD
Stochastic D
Parameters
26, 12, 9
14, 3, 3
Trade
Buy / Cover
Short / Sell
MACD Line crosses up through Signal Line and Stochastic D Line is less than 80.
MACD Line crosses down through Signal Line and Stochastic D Line is greater than 40.
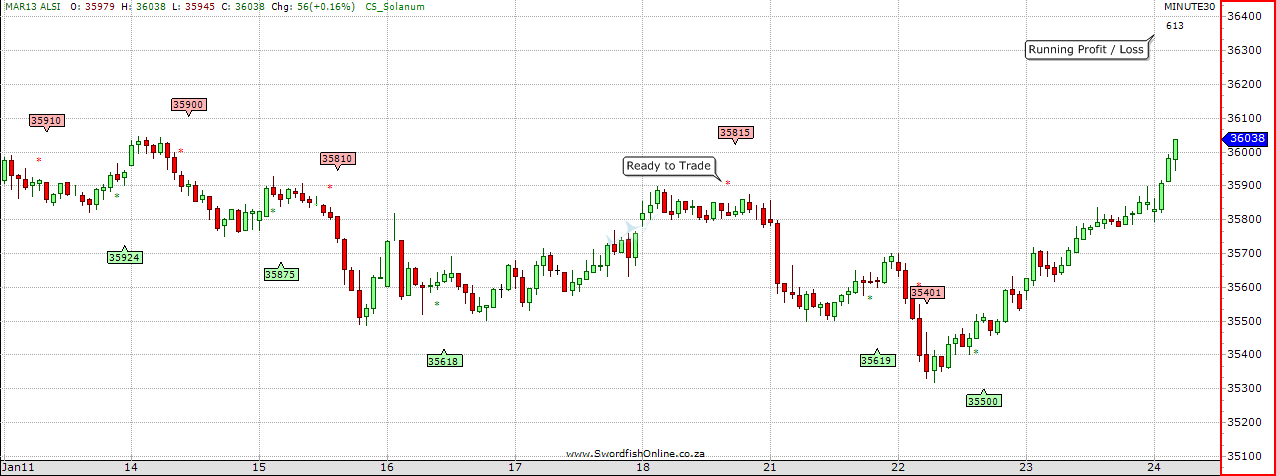
| Trade | Open | Close | Profit/Loss | |||||
| Short | 2013/01/15 14:29 | 35810 | 2013/01/16 12:59 | 35618 | R 1,892.00 | |||
| Long | 2013/01/16 12:59 | 35618 | 2013/01/18 15:29 | 35815 | R 1,942.00 | |||
| Short | 2013/01/18 15:29 | 35815 | 2013/01/21 16:29 | 35619 | R 1,932.00 |
Execute trade on Open of the next bar / candle as near to the opening price as possible.
The following three trade examples serve to illustrate the concept:

Swordfish Indicator
The Swordfish indicator for Synergy Solanum does not require any parameters to be added and is therefore very easy to install.
Create the Synergy Solanum Indicator on your Swordfish by following the instructions below:
Follow the detailed instructions for the Custom Indicator Installation Example if you are unsure of how to add an indicator or watch our YouTube video.
Create a new custom FML script. Mine is named: CS_Solanum
Download the indicator script file on the right. Copy and paste the text in the file into the Script area. Use CTRL-V on your keyboard to paste.
Add the indicator to the same chart area as the main price chart.
Swordfish Indicator:

|
CS_SolanumV1.1 SF Current .txt Size : 1.14 Kb Type : txt |
A * will appear above or below the current bar when a valid signal is active. Trade at the open of the next candle as near to the indicated opening price as possible. The profit or loss of the currently open trade is indicated at the top right of the chart.
Summary
Advantages
- 30-Minute periodicity makes it easy to trade Solanum throughout the day, with limited chart watching.
- Fairly smooth equity curve, with limited drawdowns.
- System should be possible to automate.
Disadvantages
- Solanum is active for the entire trading day and year. No breaks.
- Trading Solanum requires an ongoing commitment and patience.
- System trades often due to lack of confirmation.
- There are some large capital drawdowns.