The Weekly High Low Indicator (WeekHL) is drawn as an overlay on any Swordfish Main price chart. This indicator does not require any parameters and is easy to add to your Swordfish installation.
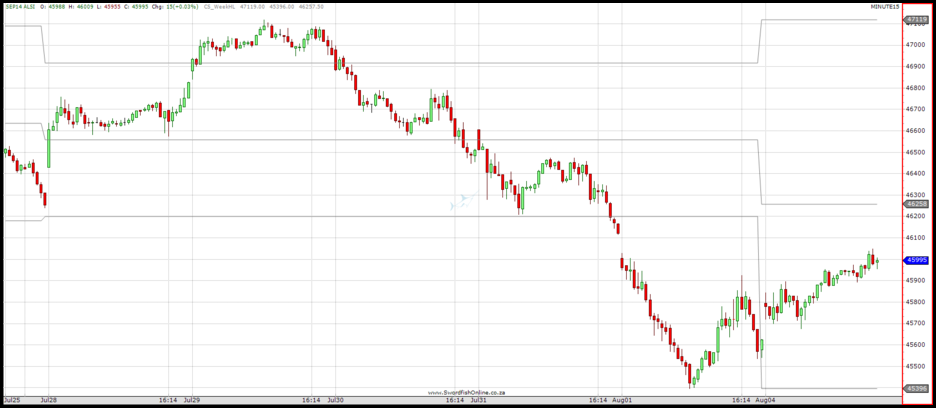
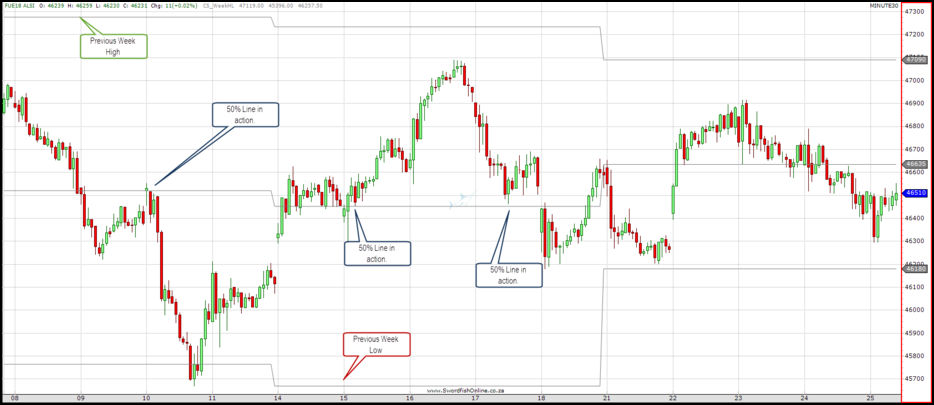
The indicator draws two light gray lines to show the previous week's high and low points on the chart. A third light gray line shows the half-way (50%) point between the high and low lines. These lines may be used for intraday support and resistance.
The 15-minute chart below shows the Weekly High Low lines at 15:40 on 2014-08-04.
The 30-minute chart below shows the 50% line in action during mid-July 2014.
Create the Weekly High Low Indicator on your Swordfish by following the instructions below: Follow the detailed instructions for the Custom Indicator Installation Example if you are unsure of how to add an indicator or watch our YouTube video.
Download the Swordfish indicator script file. Use Ctrl-V to paste the code from the downloaded file into the script area.