The Weekly Daily EMA Indicator (WDEMA) is drawn as an overlay on any Swordfish Main price chart. The Weekly Daily EMA uses two parameters to set the exponential moving average periods. Be sure to create the parameters exactly as shown.
The indicator draws lines to show the weekly and daily (EOD) EMAs on an intraday chart.
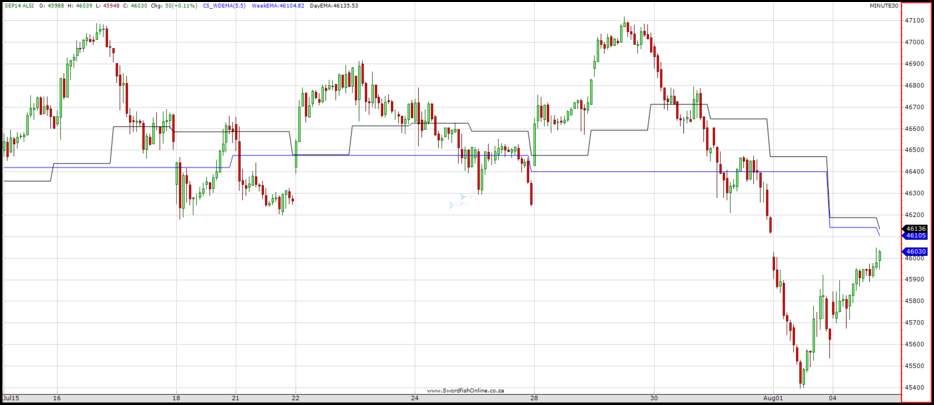
The Weekly EMA line is drawn in blue.
The Daily EMA line is drawn in black.
The 30-minute chart below shows the Weekly Daily EMAs at 15:50 on 2014-08-04.
Create the Weekly Daily EMA Indicator on your Swordfish by following the instructions below: Follow the detailed instructions for the Custom Indicator Installation Example if you are unsure of how to add an indicator or watch our YouTube video.
Download the Swordfish indicator script file. Use Ctrl-V to paste the code from the downloaded file into the script area.