Swordfish Indicators Volume Weighted Exponential Moving Average
Updated: 2013/07/29
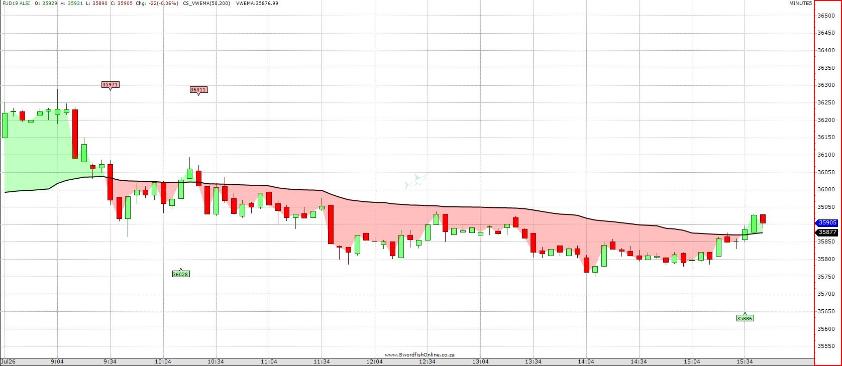
The Volume Weighted Exponential Moving Average (VWEMA) is drawn as an overlay on any Swordfish Main price chart.
The VWEMA is shown as a line and regions between the VWEMA and the candle close are colour filled. The closing price of the crossing candle is displayed as green or red label.
Create the VWEMA Indicator on your Swordfish by following the instructions below: Follow the detailed instructions for the Custom Indicator Installation Example if you are unsure of how to add an indicator or watch our YouTube video.
The Swordfish indicator can be downloaded here: The first indicator code file includes an audio alert that will sound when the VWEMA is crossed by the closing price. The second script code file does not include the audio alert.
The Volume Weighted Exponential Moving Average indicator uses 2 parameters that have to be added manually when you create the script.
MAp is the number of periods used by the EMA function.
LabelGap specifies the distance between the candles and the labels. Use a smaller number for shorter periodicity charts and larger for EOD and longer.
CS_VWEMA Volume Weighted Exponential Moving Average
Name MAp LabelGap
Default 50 200
Minimum 2 10
Maximum 200 1000
Type Double Double
The sample shows CS_VWEMA overlayed on the Main Swordfish price on a 5 minute chart on the 26th of July 2013.