Swordfish Indicators
Automated Daily Camarilla Pivots
Current Version: 2.1
Updated: 2014/12/14
The primary 4 Camarilla Pivot Levels are automatically drawn on any Swordfish intra-day chart using the previous day's Session Close (Last Trade at 17:30) or the MTM Close.
The Camarilla Pivots Indicator (CS_CP6) uses nine parameters similar to CS_PP7. Be sure to create all these parameters exactly as shown.
Version 2.1 Features Added
- This is the first version of the Capital Synergy Camarilla Pivots indicator.
- Both the standard Pivot Point as well as the mid-point between the Camarilla R1 and S1 is shown.
- The Camarilla Pivots R5, R6, S5 and S6 are not shown yet.
Line Colours
- Resistance pivot lines are shown in green.
- Support pivot lines are drawn in red.
- The mid pivot lines are dotted.
- The daily pivot point (PP) is displayed in blue.
- The daily camarilla mid pivot (Mid) is displayed in gray.
- The session close value is coloured black.
- The MTM close value is coloured gray.
- The previous day Open, High and Low is shown in teal.
Previous Versions
- None
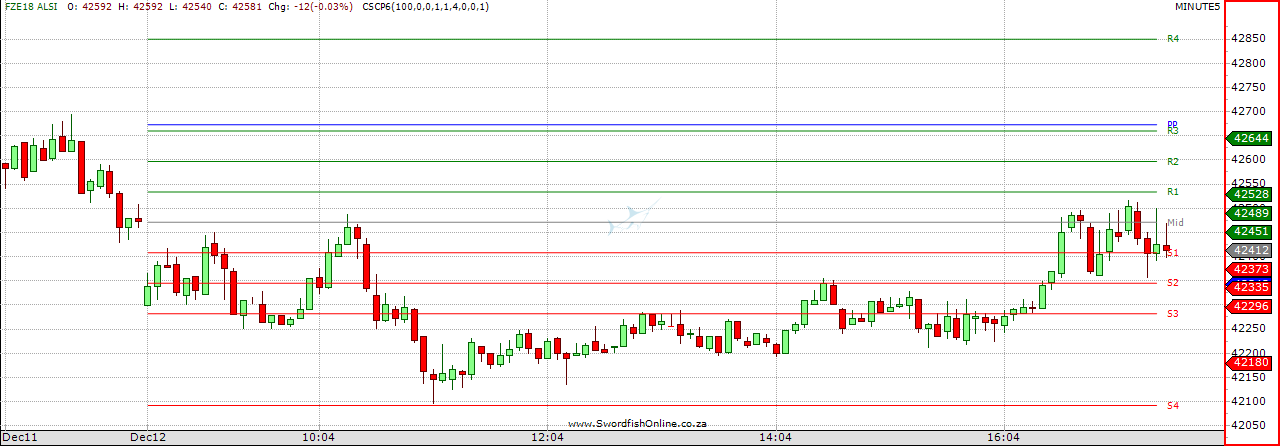
The 5-minute chart below shows the Automated Camarilla Pivots for Friday 2014-12-12.
The parameters are set as 100, 0, 0, 1, 1, 4, 0, 0, 1.
Create the Automated Camarilla Pivots Indicator on your Swordfish by following the instructions below:
Follow the detailed instructions for the Custom Indicator Installation Example if you are unsure of how to add an indicator or watch our YouTube video.
Download the Swordfish indicator script file. Use Ctrl-V to paste the code from the downloaded file into the script area.
Swordfish Indicator:

|
CS_CP6V21.txt Size : 5.056 Kb Type : txt |
This version uses 9 parameters that have to be added manually when you create the script:
CS_CP6
Automated Pivot Points
Name
PLimit
MTMUse
PLimitUse
ShowR
ShowS
ShowNL
ShowHLC
ShowMid
ShowL
Default
100
0
1
1
1
4
1
1
1
Minimum
1
0
0
0
0
1
0
0
0
Maximum
1000
1
1
1
1
4
1
1
1
Type
Double
Double
Double
Double
Double
Double
Double
Double
Double
PLimit
MTMUse
PLimitUse
ShowR
ShowS
ShowNL
ShowHLC
ShowMid
ShowL
Proximity limit determines how near a pivot line must be to the current intra-day close before it will be displayed.
Adjust lower for more pivot lines and higher for less.
To use MTM Close to calculate the pivot points, set this value to 1. To use the Session Close set value to 0.
To use Proximity limit to show only nearby the pivot points, set this value to 1. To show all pivot levels set it to 0.
To show the green resistance lines, set this to 1. To not show any resistance levels set this parameter to 0.
To show the red support levels, set this to 1. To not show any support pivots set this parameter to 0.
Set this to between 1 and 4 to determine how many pivot levels are displayed.
Keep as 1 to show the last day Open, High and Low. Change to 0 to not show the lines.
To show the mid pivots, set this parameter to 1. To remove them from the charts, change it to 0.
To show the line labels, set this parameter to 1. To remove them from the charts, change it to 0.
In order to clearly see the pivot lines you will have to experiment with the parameters. Try to limit the number of lines or show only support or resistance lines as needed.
Zoom in and out to optimize the display.
Set the periodicity to 1-minute when the market opens to see the pivot lines sooner.